How to Monitor Crop Health with Sentinel-2 (Northern Europe Guide)
2025-09-10 · 7 min read · Agriculture · Sentinel-2
TL;DR: Use Sentinel-2 to track crop health as change over time, not a single “good or bad” map. Anchor on EVI2 for stable vigor, add a red-edge index for chlorophyll and nitrogen sensitivity, and use a SWIR-based moisture index to catch water stress early.
What “crop health” looks like in data
On the ground, “crop health” is shorthand for establishment, nutrient sufficiency, water status, disease pressure, and timing. From orbit, you are watching how reflectance shifts across the red, near-infrared (NIR), red-edge, and shortwave-infrared (SWIR) parts of the spectrum as plants emerge, canopy closes, and stress arrives. The practical goal is not a perfect-looking image. It is a defensible signal that tells you which parcels to scout and why.
The easiest mistake in Northern Europe is treating every date as equally trustworthy. In cloud season, the best operational habit is to track two things together: the index value and the valid observation coverage that produced it. If coverage is weak, your confidence should be weak.
Sentinel-2 details that matter for field-scale monitoring
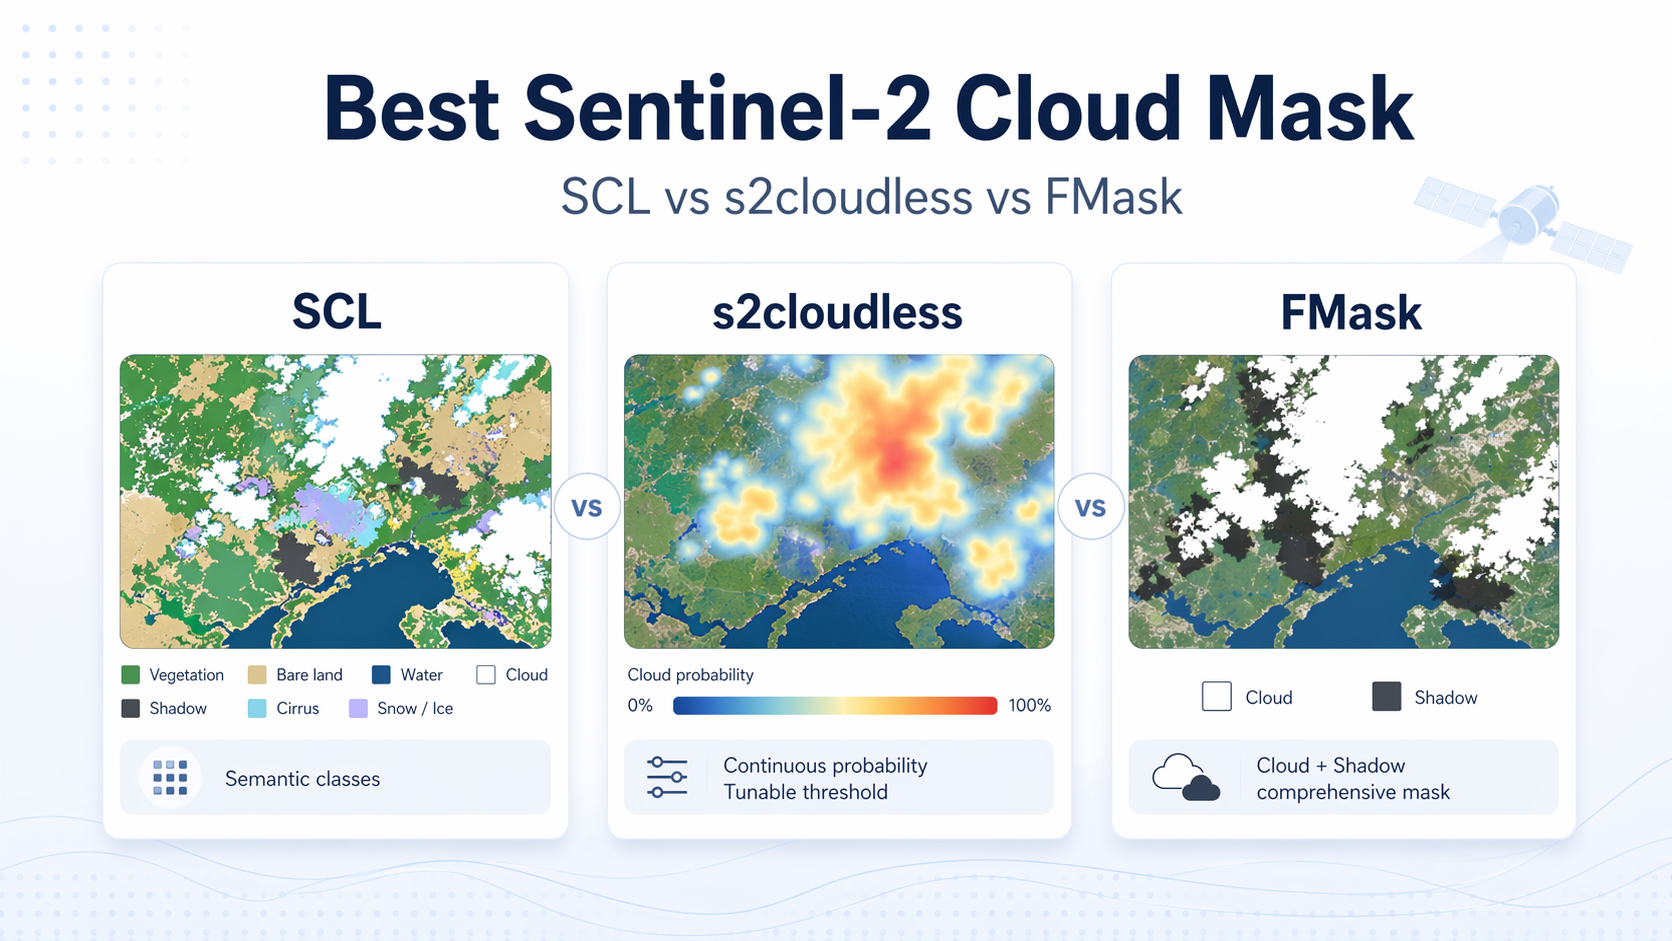
You will get better results if you decide up front which Sentinel-2 processing level you want to standardize on. Level-1C is TOA (top-of-atmosphere) reflectance, and Level-2A is BOA (bottom-of-atmosphere) surface reflectance with additional quality layers like scene classification (including clouds and cloud shadows). For cross-date analytics within a season, Level-2A is usually the right default because it is designed to be more comparable over time, and the scene classification layer is immediately useful for cloud and shadow masking.Copernicus Sentinel-2 Level-2A (BOA surface reflectance and included scene classification for clouds and shadows)
Resolution is the second “gotcha”. Sentinel-2’s visible and NIR bands commonly used for vigor at field scale are available at 10 m, while red-edge and SWIR bands that are valuable for nitrogen and moisture are natively 20 m. That is not a problem, but it does mean you should resample once, lock a grid, and compute indices after co-registration so your parcel statistics are stable across dates and across indices.ESA Sentinel-2 instrument overview (13 bands with 10 m, 20 m, and 60 m groups)
Indices to anchor your workflow
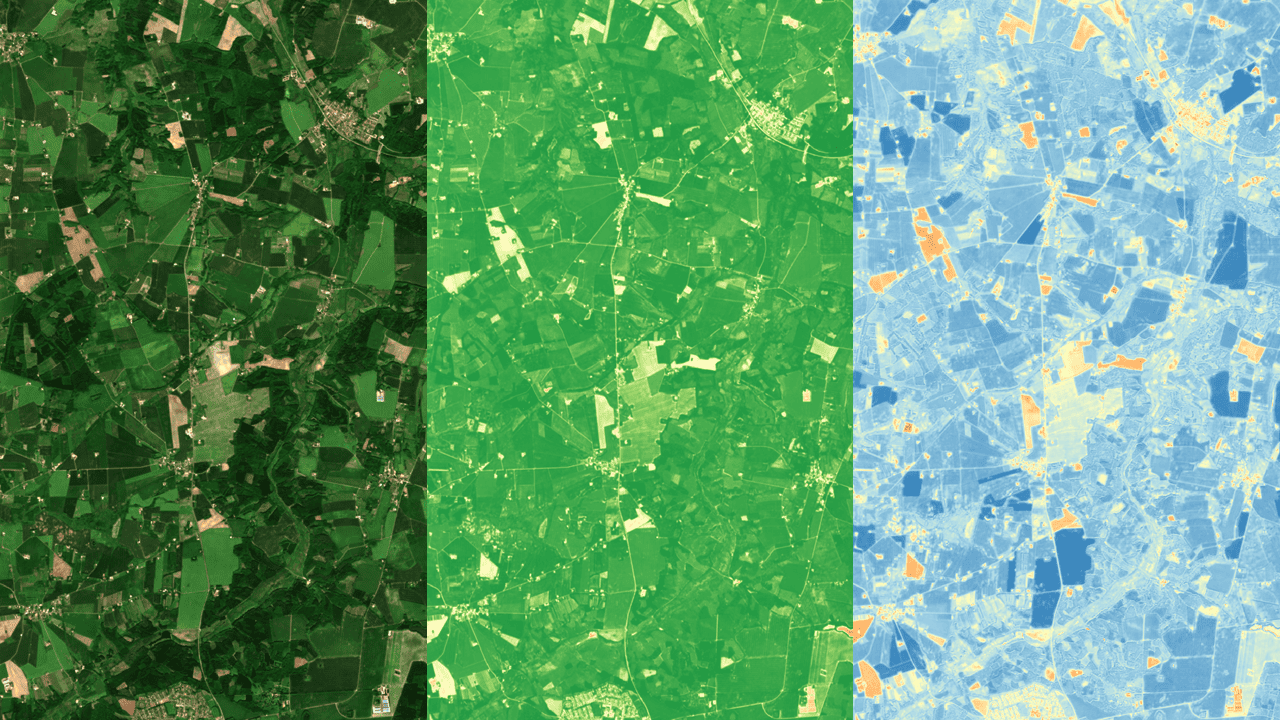
A good Sentinel-2 workflow does not need many indices. It needs a small set that behave differently, so you can separate “vigor changed” from “chlorophyll changed” from “water content changed”.
Start with a vigor pair: NDVI (Normalized Difference Vegetation Index) and EVI2 (Enhanced Vegetation Index 2). NDVI is the common language and is excellent for continuity across tools and teams. EVI2 tends to behave more calmly when soils are bright, haze is thin, or canopies are dense enough that NDVI compresses near its upper plateau. EVI2 is defined as:
EVI2 = 2.5 × (NIR − Red) / (NIR + 2.4 × Red + 1)
That “+1” term and the red weighting are why EVI2 often looks less jumpy day to day in real farm data, especially when you are comparing early season to peak biomass.Jiang et al. (2008), Remote Sensing of Environment: EVI2 definition and rationale
When nitrogen or chlorophyll is the question, add a red-edge normalized difference index. Many teams use the name NDRE (Normalized Difference Red Edge), and many tools use NDVIre (Red-Edge NDVI). The core idea is the same: use NIR and a red-edge band so the index stays sensitive later into the season when chlorophyll differences matter but NDVI is already saturated in dense canopy. The formula is:
(NIR − RedEdge) / (NIR + RedEdge)
On Sentinel-2, you typically choose one red-edge band and keep it consistent across the season so that changes reflect agronomy, not a moving definition.ArcGIS Pro documentation: Red-Edge NDVI (NDVIre) formula and use for mid to late season vegetation health
For water stress, use an SWIR-based moisture index such as NDMI (Normalized Difference Moisture Index), which compares NIR and SWIR. In vegetation, SWIR responds strongly to changes in leaf water content, and NDMI often drops before a vigor index does when drought stress is beginning. NDMI is defined as a normalized ratio of NIR and SWIR reflectance, and it is widely used as a vegetation moisture proxy.USGS: NDMI definition and interpretation as a vegetation water content indicator using NIR and SWIR
A field-first way to run it in Northern Europe
Treat parcels as the primary object, not pixels. You want a repeatable time series per parcel that you can explain to an agronomist, a farmer, or an auditor.
- Standardize inputs: Choose Level-2A for analytics, resample once to a fixed grid, and mask clouds and shadows using the scene classification layer.
- Compute a small index set: NDVI and EVI2 for vigor, a red-edge index for chlorophyll sensitivity, and NDMI for moisture stress.
- Aggregate per parcel: Use robust statistics like the median, and always record valid-pixel coverage so you know when a dip is real versus cloud-driven.
- Flag change, not absolute values: Compare each parcel to its own recent baseline and to local peers with the same crop and planting window.
In cloud season, the “coverage” field is not a nice-to-have. It is how you avoid chasing noise. If you do nothing else, put a minimum valid-pixel threshold into your pipeline and make “insufficient observations” an explicit state.
How to read the patterns without overreacting
Healthy establishment usually looks like a smooth rise in EVI2 and NDVI with low within-parcel variability. Patchy emergence looks like elevated variability, not just a lower median. Nitrogen limitation candidates often appear as parcels whose red-edge index drifts low relative to peers while vigor stays broadly stable, which can happen before NDVI looks alarming.
Moisture stress often shows up as an NDMI decline ahead of any visible drop in vigor. In irrigated systems, a step back up after irrigation is meaningful only if it persists into the next clear observation window, because a single-date bounce can be a cloud artifact. Sudden localized declines, especially near headlands, can indicate disease, lodging, or compaction, but you should treat them as “go look” signals, not diagnoses.
A practical rule: If an index moves but coverage is low, do not interpret. If coverage is strong and multiple indices move in a consistent way, interpret and act.
ClearSKY in practice
In ClearSKY workflows, the principle is simple: deliver an aligned stack that makes parcel statistics easy and consistent across indices. If you want indices delivered alongside the source bands, request the relevant bands and normalized-difference layers together so the output stays provenance-clean and repeatable. For indices like EVI2, compute immediately from the delivered bands using a fixed formula and keep the processing version pinned across the season so “change” reflects fields, not pipeline drift.
FAQ
›Should I use Sentinel-2 Level-1C or Level-2A for crop monitoring?
Level-2A is usually the better default for season-long analytics because it is surface reflectance and includes a scene classification layer you can use for cloud and shadow masking. Level-1C can still be useful for quick looks, but cross-date comparability is typically harder because atmospheric effects are not corrected. The key is consistency: Choose one for the season and avoid mixing levels in the same time series.
›Why do EVI2 and NDVI often tell slightly different stories?
NDVI is simple and widely understood, but it can compress near its upper range in dense canopy and can be sensitive to background and atmospheric effects. EVI2 modifies the red contribution and adds a stabilizing term, which often makes it steadier day to day in real farm conditions. Using both helps you separate true canopy change from index behavior.
›What is the fastest way to make results reliable in cloudy Northern Europe?
Treat valid observation coverage as a first-class metric and do not interpret low-coverage dates. Use a cloud and shadow mask, aggregate to parcels with robust statistics, and enforce a minimum valid-pixel threshold. If a parcel does not meet the threshold, label it as insufficient observations rather than forcing a value.
›Which index is best for early signs of drought stress?
A SWIR-based moisture index like NDMI is commonly used because SWIR responds strongly to vegetation water content. In many cases NDMI declines before vigor indices do, which makes it useful for early warning. You still need adequate clear-sky coverage, because cloud contamination can mimic moisture swings.
›How do I avoid chasing noise when indices jump around?
Use parcel medians rather than single pixels, and always look at within-parcel variability and coverage alongside the median. Compare the parcel to its own baseline and to nearby peers instead of relying on a universal threshold. When multiple indices move together on a high-coverage date, the signal is more likely to be real.