Nihonbashi Space Week 2026
Contact Morten FjordTokachi Plain / Hokkaido, Japan
A growing season in Hokkaido.
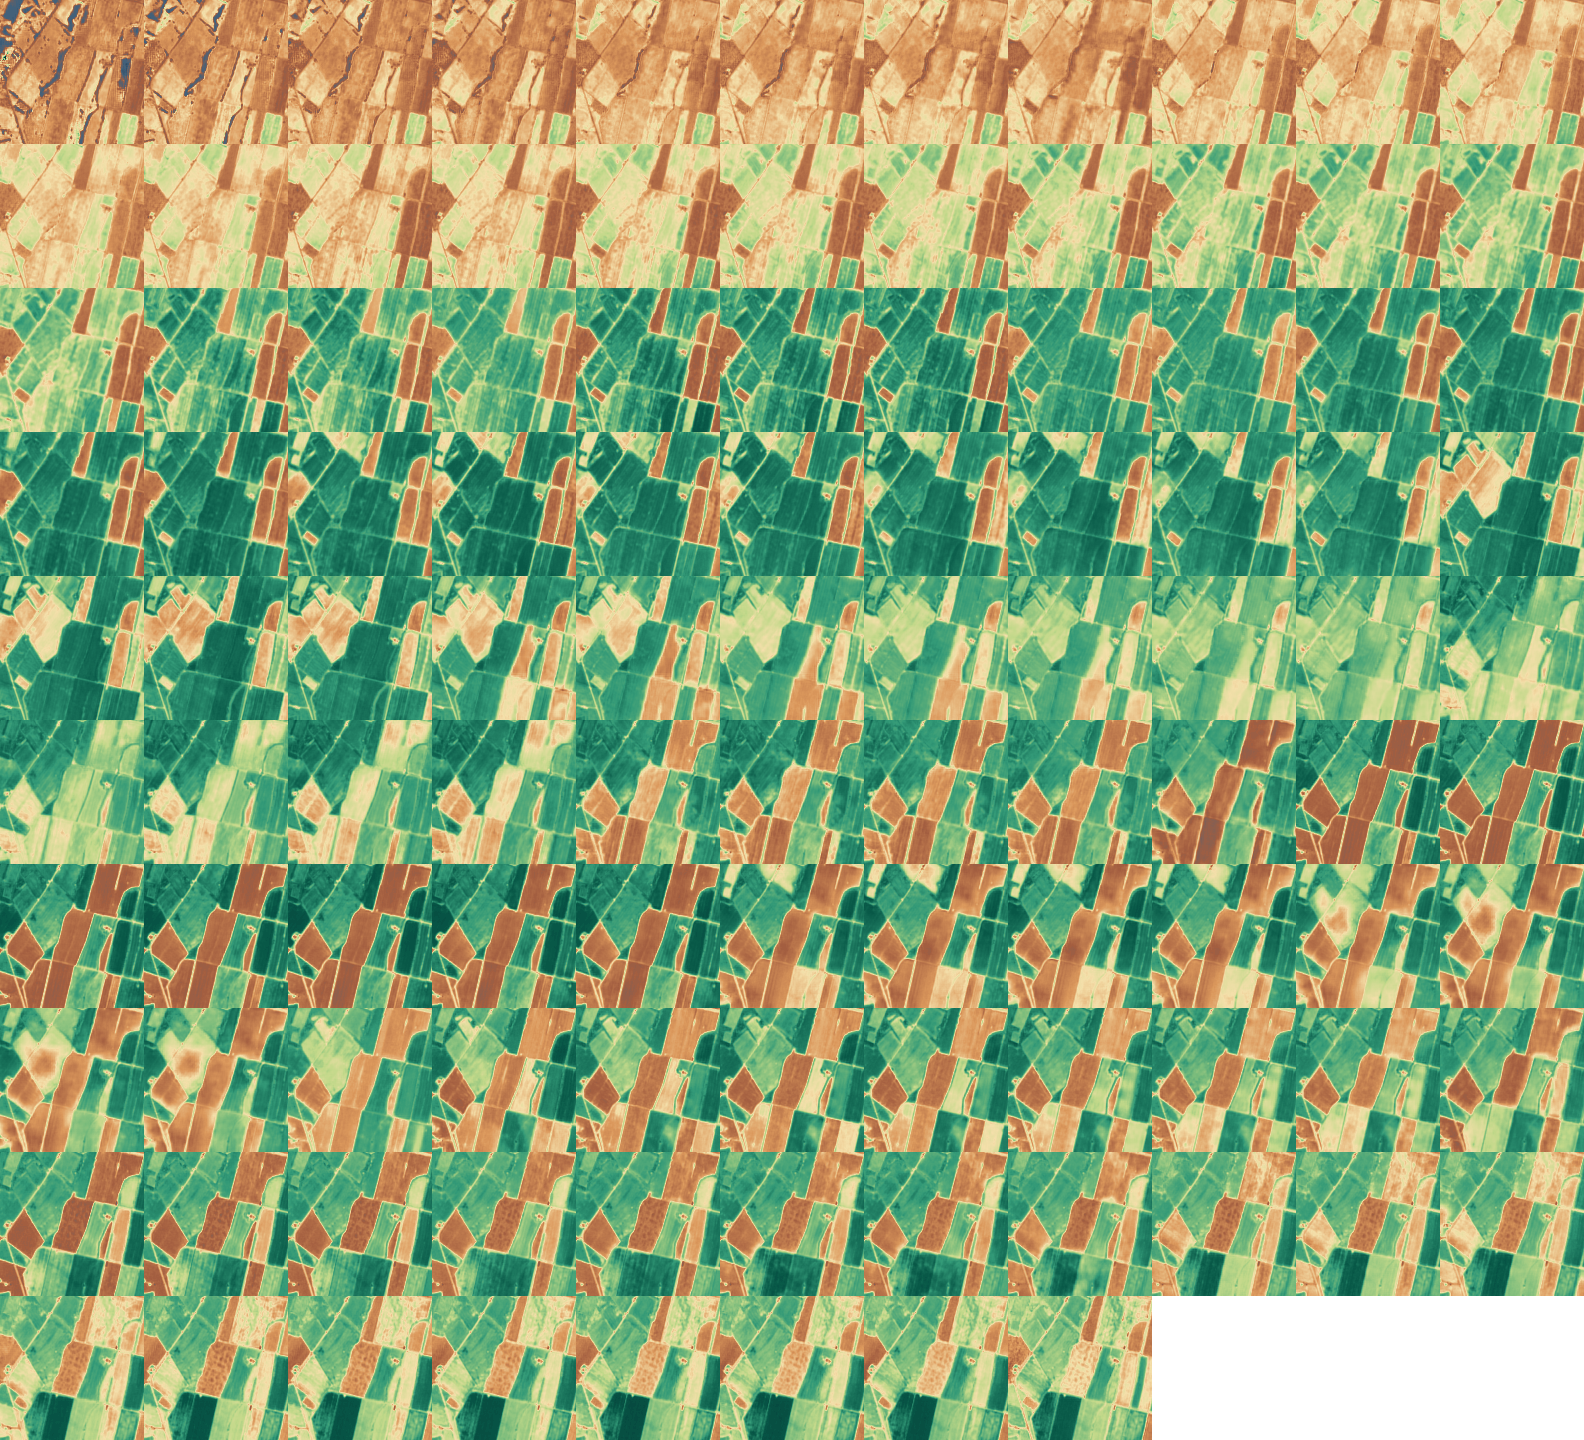
Watch the fields northwest of Obihiro change from April to October. ClearSKY satellite fusion imagery follows the same landscape every two days.
- Output dates
- 107
- Source pixels
- 10 m
- Scene width
- 16 km
Field study / April–October 2026
One field through the season.
Deeper greens show higher NDVI across neighbouring fields. Each map pixel is 10 m across. The curve tracks the average inside the outlined field.
 200 m
Field greenness NDVI
0.84
The field’s mean NDVI peaks at 0.90 on 8 June 2026. Select a date on the curve to compare the field with its neighbours.
How the curve is calculated
The outline encloses 11.0 ha (1100 pixel centres). For each date we calculate the Normalized Difference Vegetation Index, (B8 − B4) / (B8 + B4), from near-infrared and red fusion outputs and average the valid pixels inside the field. Each point shows that date’s mean, with no temporal smoothing.
Usability masking / Optical imagery
Which pixels can you trust?
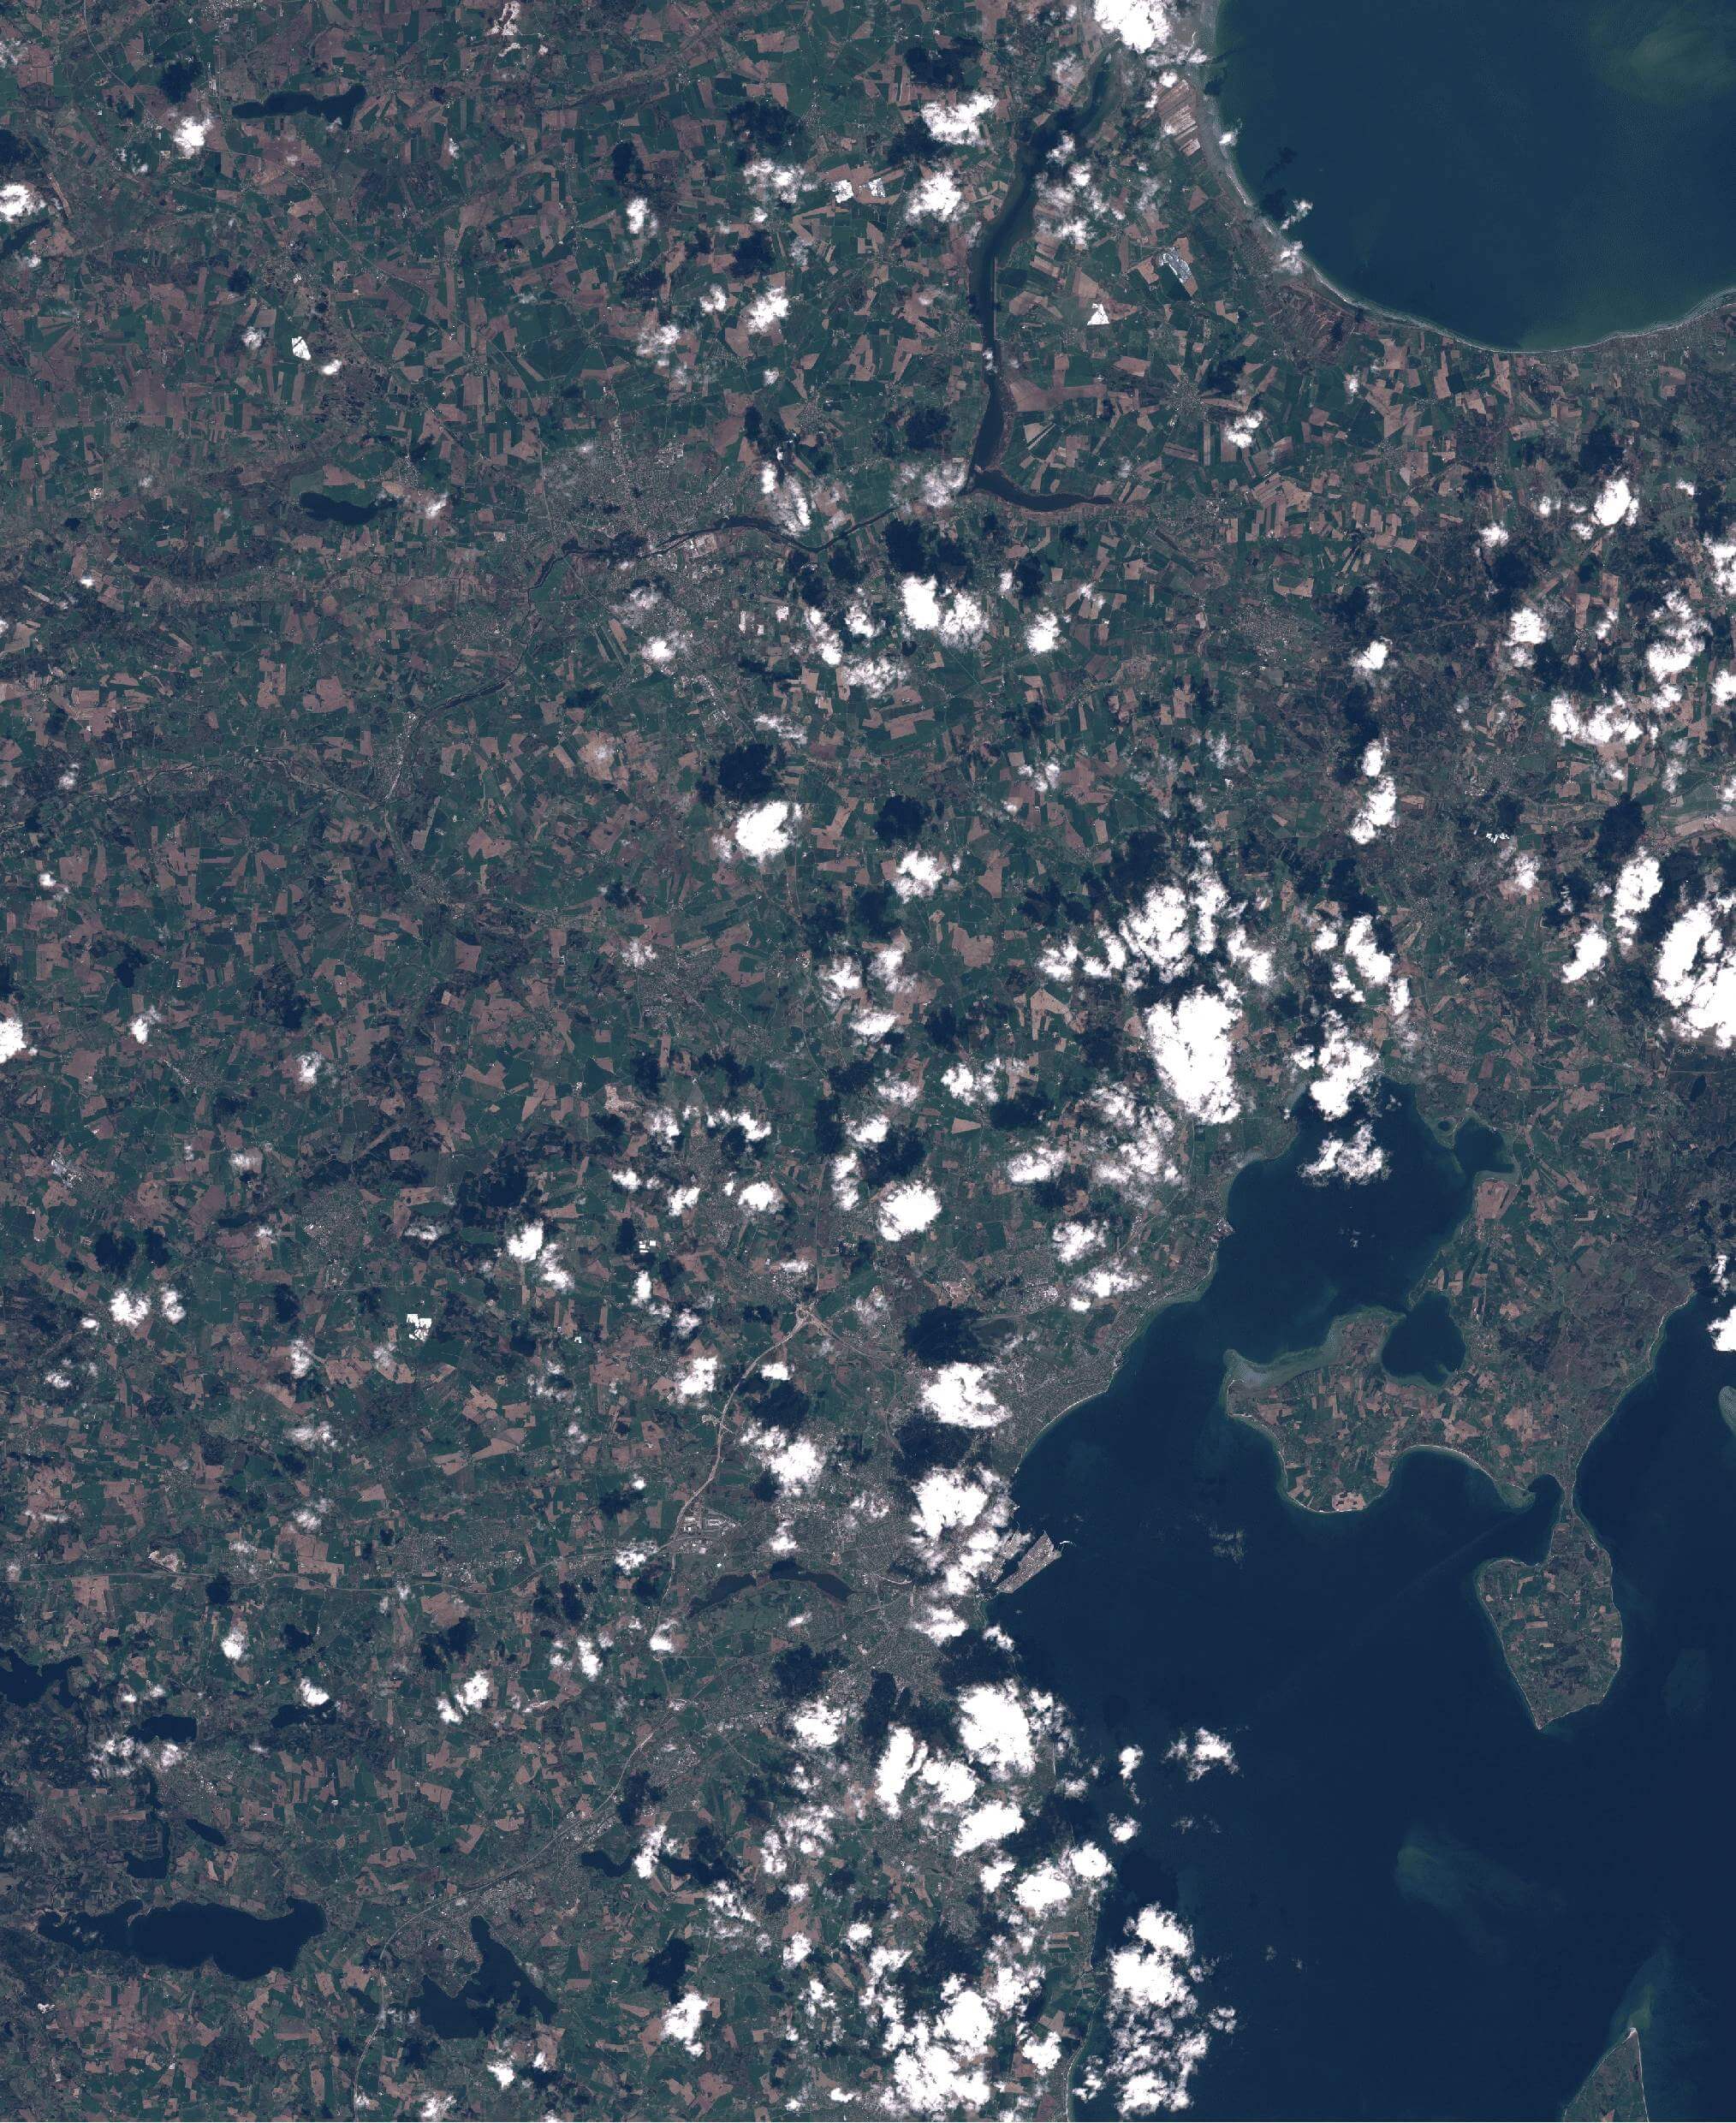
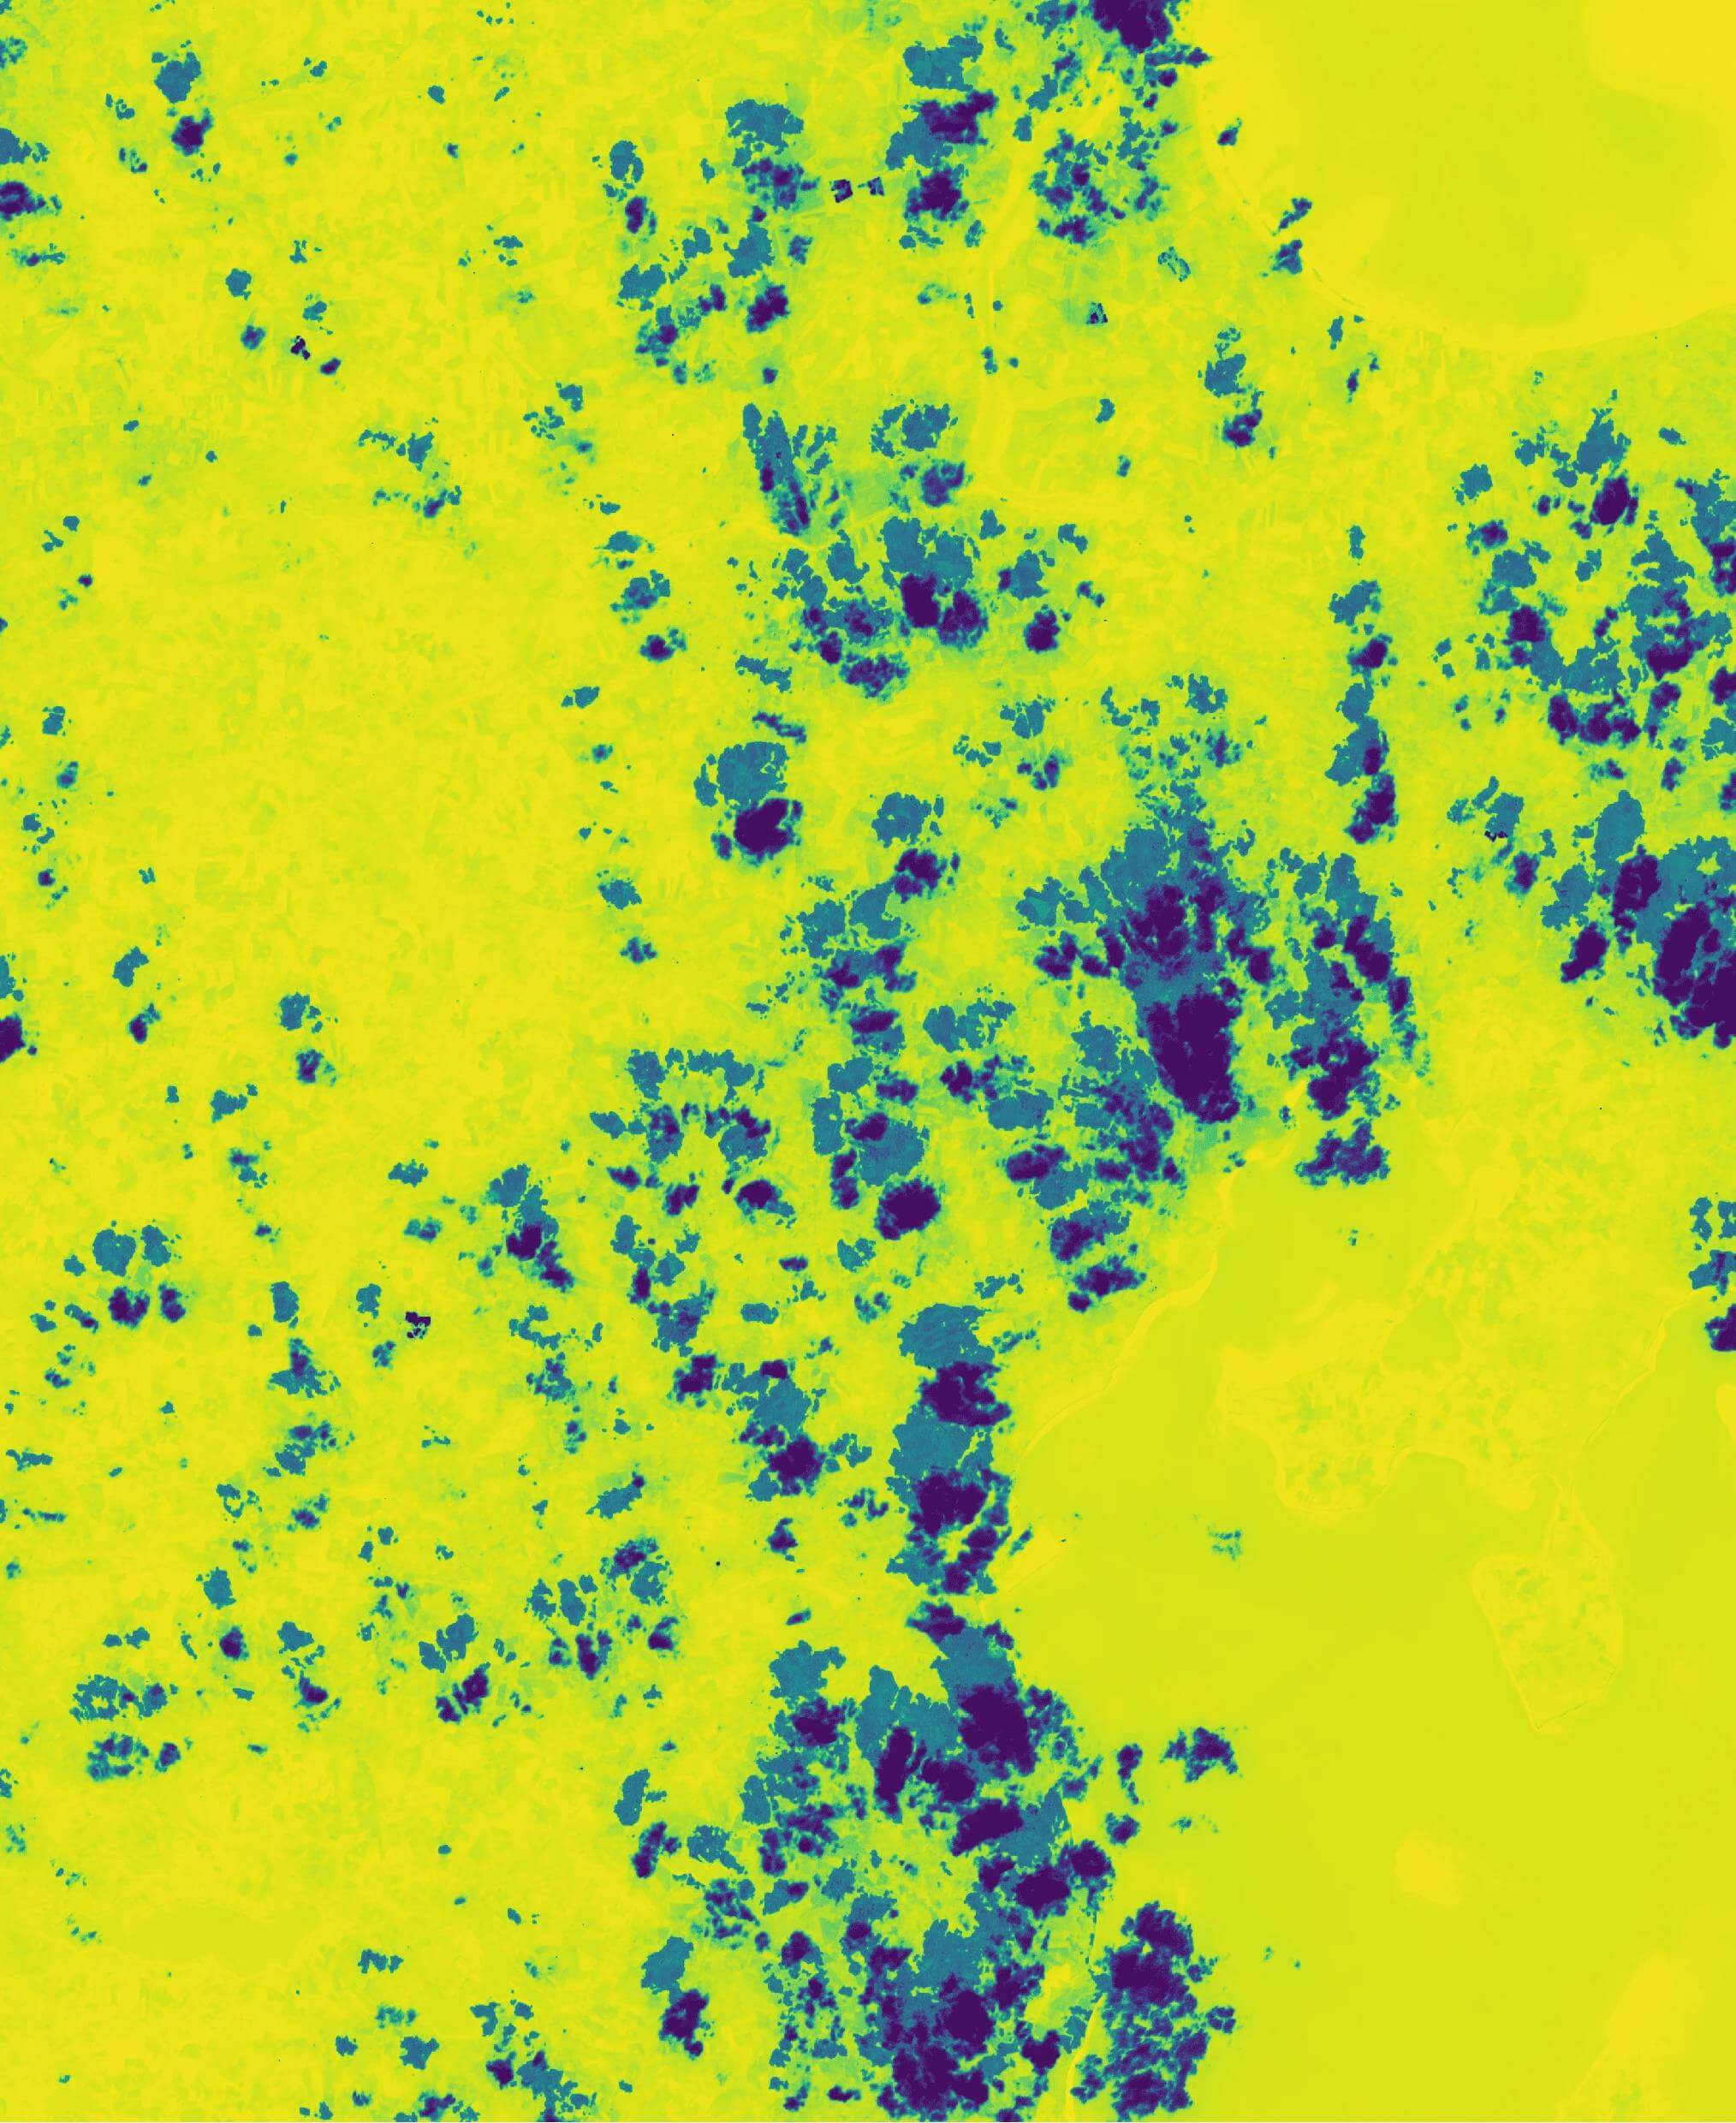
Find the bright clouds in the optical image, then look at the same spots on the score map. Purple marks low usability. Yellow marks pixels more likely to be usable.
 Optical image
 Usability score
To calculate a field average from optical imagery, you can set a minimum score and leave out pixels below it.
How pixel usability is scoredClearSKY imagery services
What would you like to monitor?
Tell Morten about your region, what you want to track and how often you need a clear view.
Tokachi imagery contains modified Copernicus Sentinel data 2026 and Landsat data courtesy of the U.S. Geological Survey/NASA, processed by ClearSKY.